🔧 Project: Predict Titanic Survivors using Microsoft Fabric
🚀 Project Overview
In this beginner-friendly machine learning project, we're using Microsoft Fabric to analyze the Titanic passenger dataset and build a predictive model that determines whether a passenger survived the disaster.
We’ll go step-by-step using Lakehouse, Notebooks, and PySpark (Python) — all inside Microsoft Fabric’s unified data platform.
✅ Lakehouse
A Lakehouse in Azure Fabric gives you a single platform to store, process, and analyze both raw and structured data, making it ideal for modern data science and analytics projects.
✅ Traditional Approach (Before Lakehouse)
| 🔹 Data Lake | 🔹 Data Warehouse |
| Stores raw, unstructured data | Stores cleaned, structured data |
| Cheap, flexible, scalable | Optimized for fast queries (BI) |
| Used by data scientists/engineers | Used by analysts and BI teams |
| Examples: Azure Data Lake Gen2 | Examples: Azure Synapse SQL pool |
➡️ Problem: These were separate systems. You had to move data from the lake to the warehouse for reporting, which caused duplication, delay, and complexity.
✅ Unified Storage in Microsoft Fabric (Lakehouse)
Now with OneLake in Microsoft Fabric:
You store all your data in one place — no need to move between lake and warehouse.
The same data can be:
Accessed as files (
CSV,Parquet) → for ML/AIQueried as structured tables → for Power BI/SQL
🧠 Example:
Imagine you upload titanic.csv to the Lakehouse:
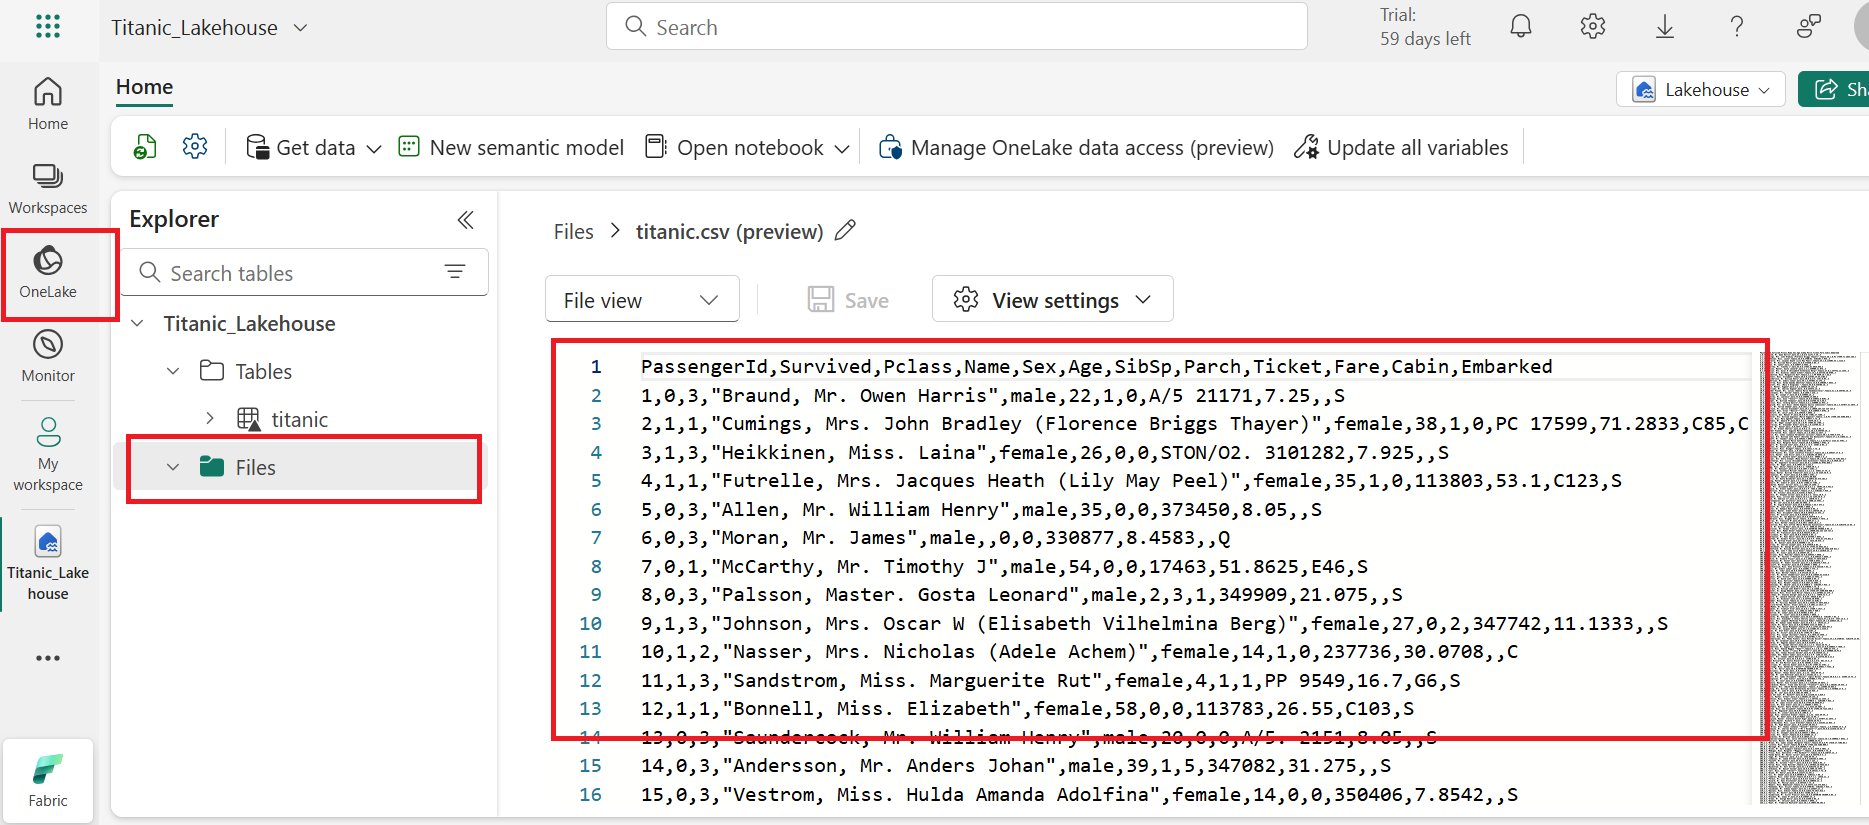
In Files: It exists as a raw file (data lake style)
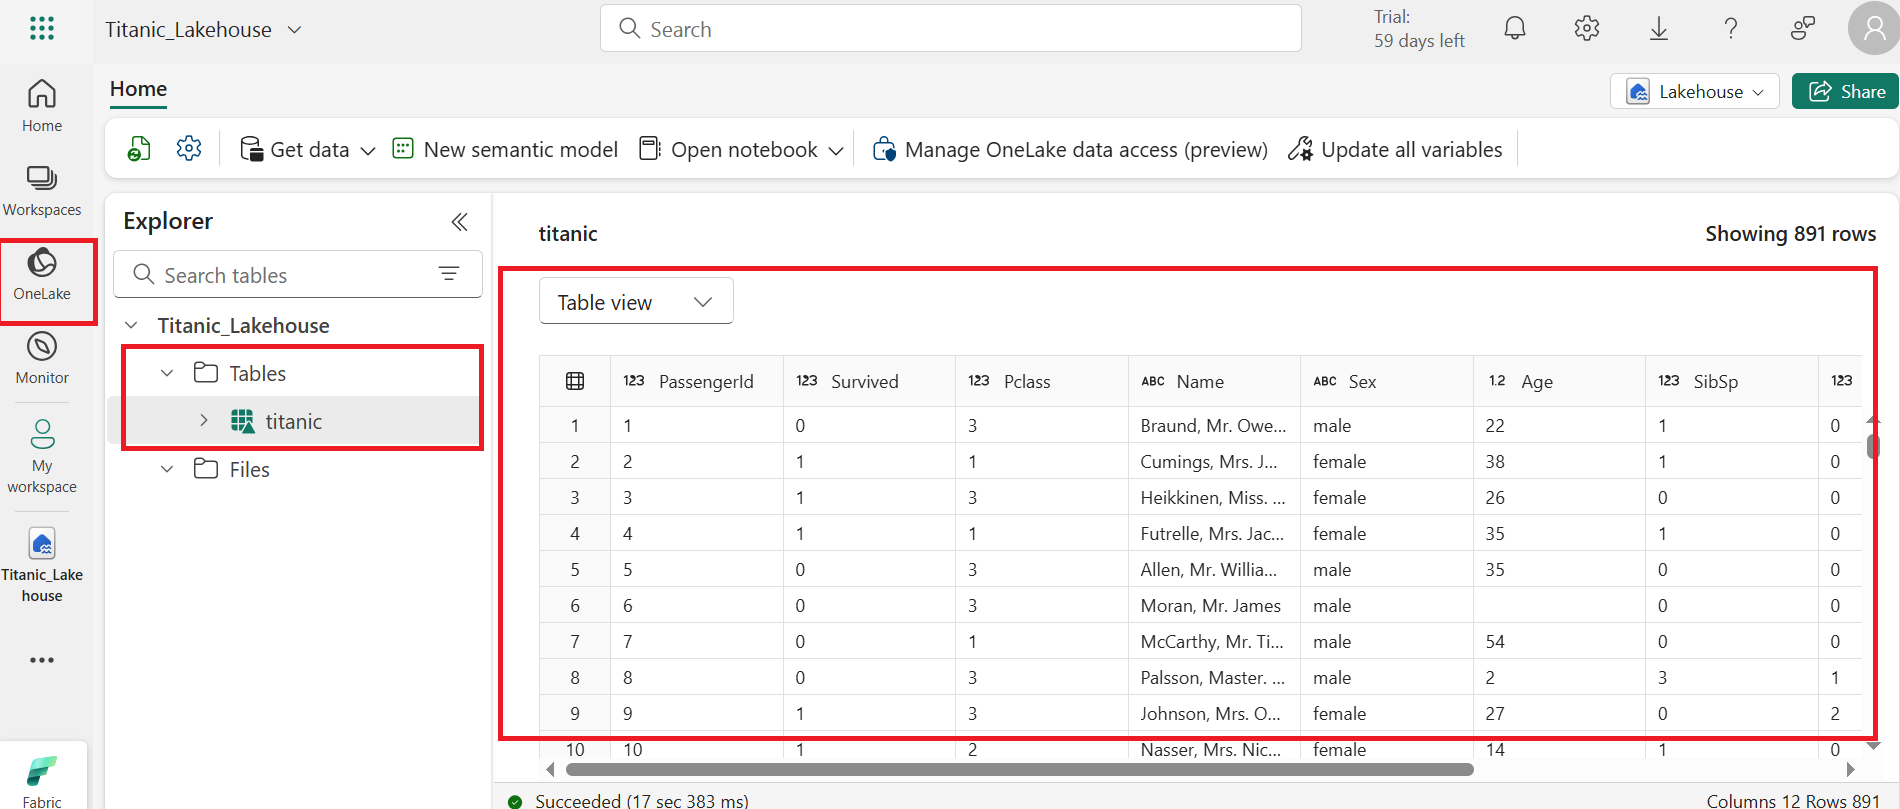
When you Load to Table: It becomes a structured table (warehouse style)
Power BI, SQL, and notebooks all use the same storage location (OneLake)
Files
Tables
🔄 Summary:
“Unified storage” means you don’t need separate systems for storage (lake) and analytics (warehouse). With OneLake, your data serves both data science and business intelligence directly — faster, simpler, and cheaper.
Create a new Lakehouse
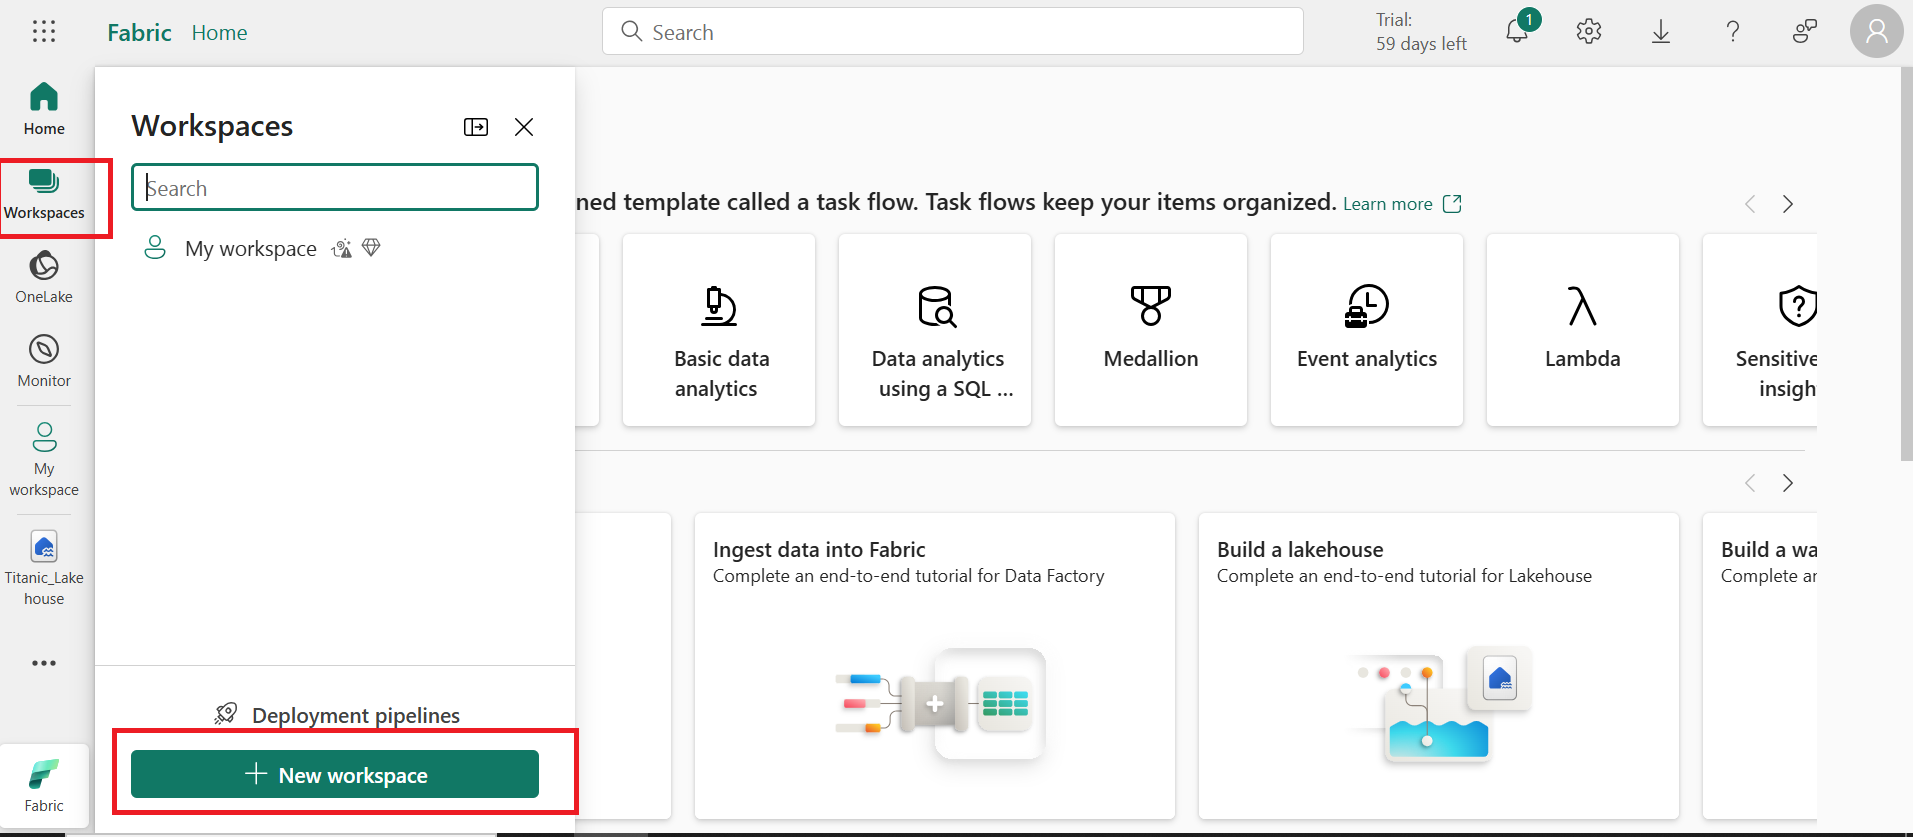
Go to My Workspace
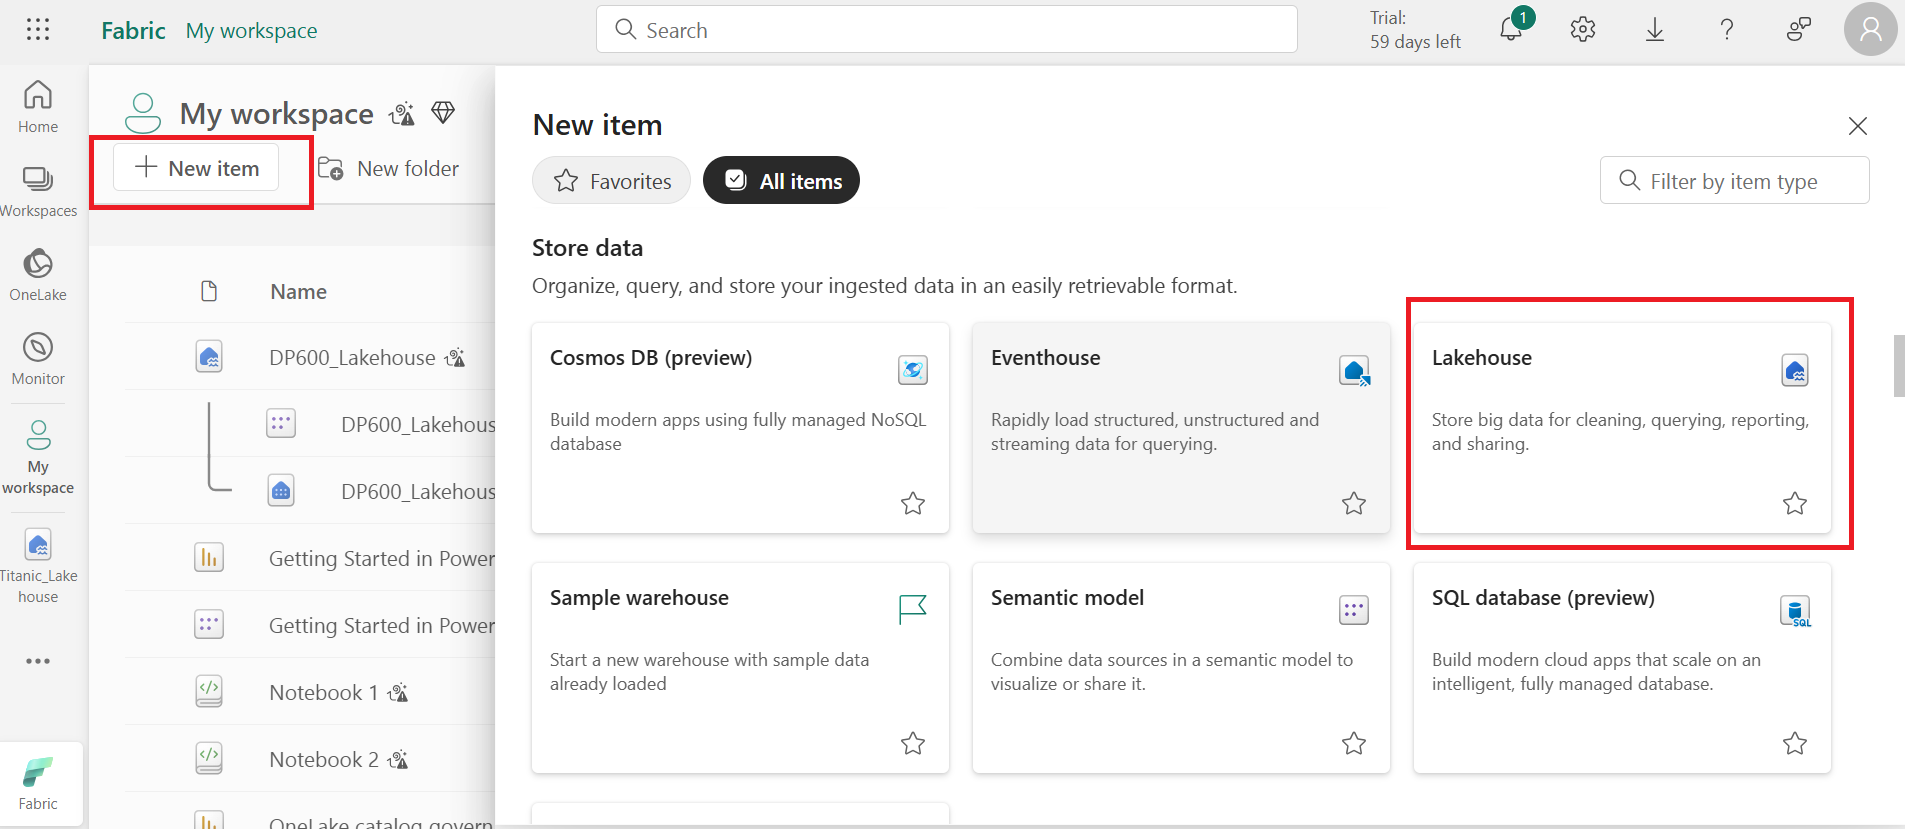
Click + New item → Lakehouse
Name it
Titanic_Lakehouse
Upload the dataset
Download
titanic.csvfrom GitHub link
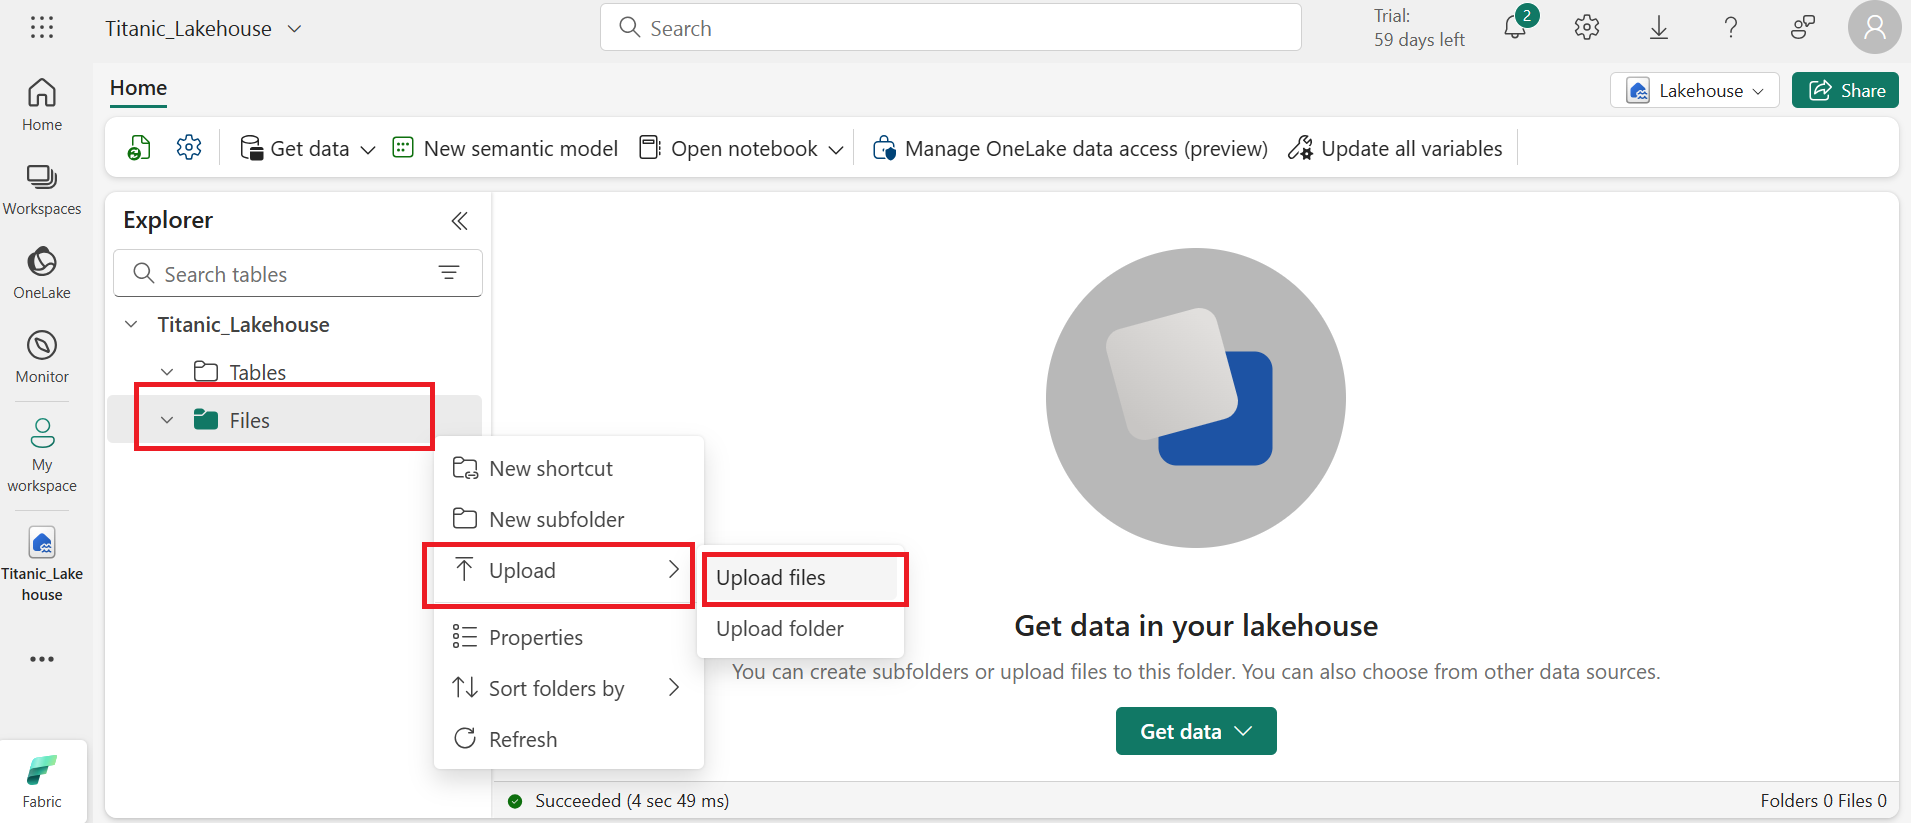
https://raw.githubusercontent.com/datasciencedojo/datasets/master/titanic.csvIn your Lakehouse, go to the Files tab
Click Upload and select
titanic.csv
Convert the file into a structured table
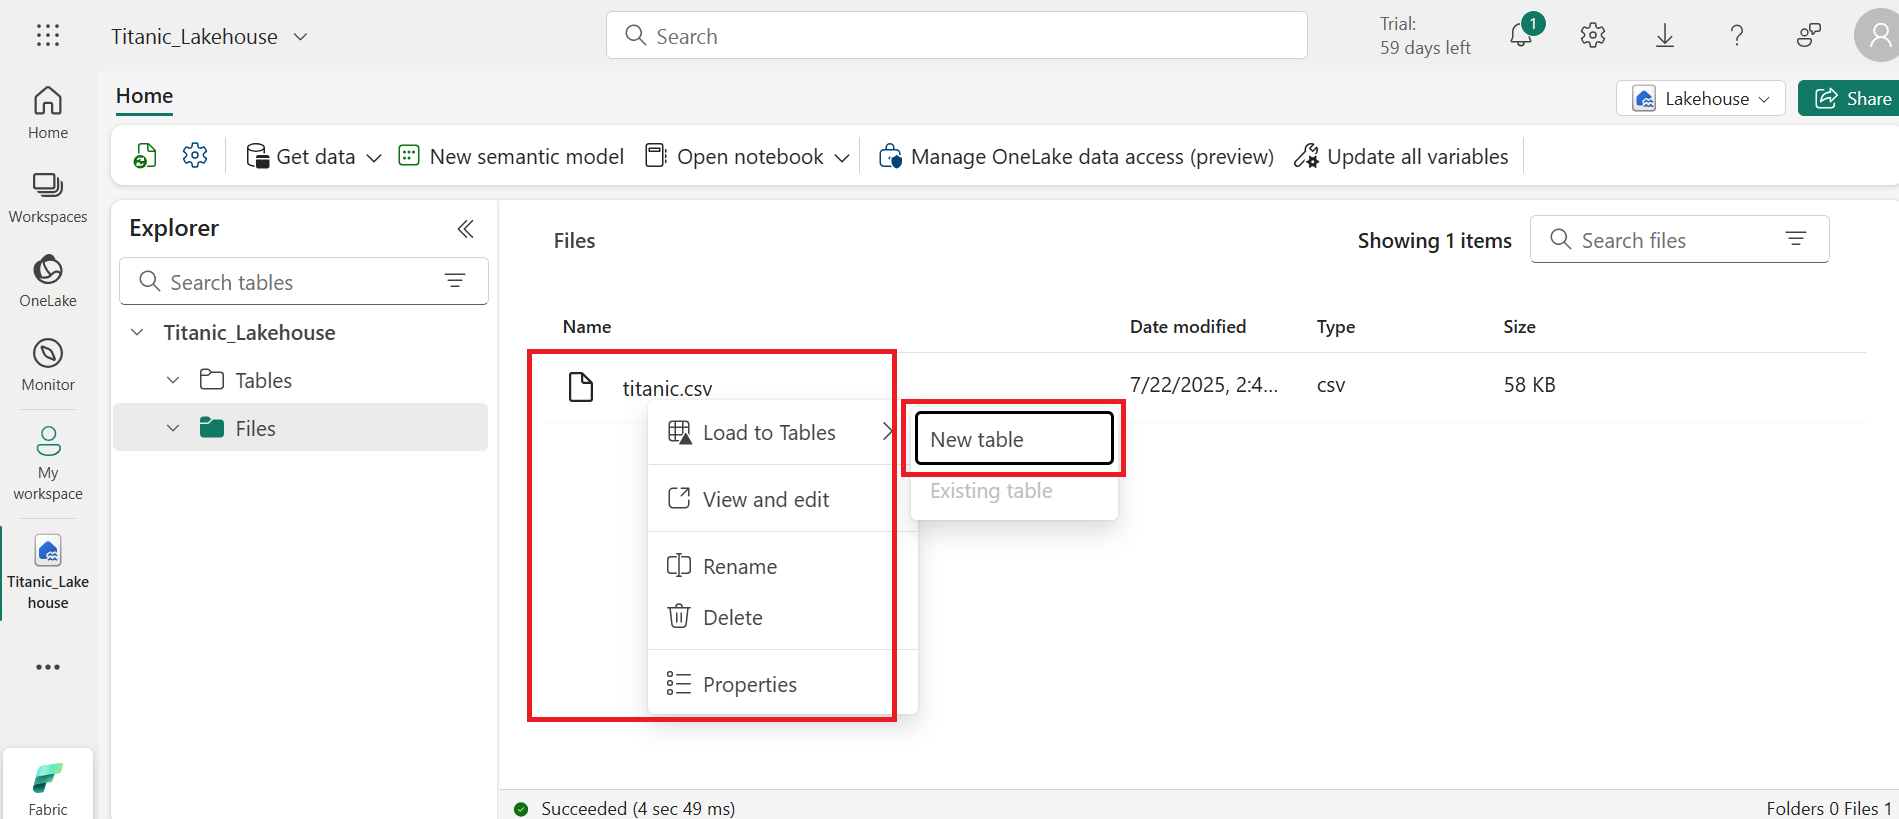
After the file uploads, right-click on
titanic.csvChoose Load to Tables → New table
Name the new table
titanicand click Load
Open a Notebook
At the top menu, click Open notebook → New notebook
Make sure the notebook is attached to
Titanic_LakehouseRead the dataset using PySpark
Run this code:
  df = spark.read.table('titanic')
  display(df.limit(5))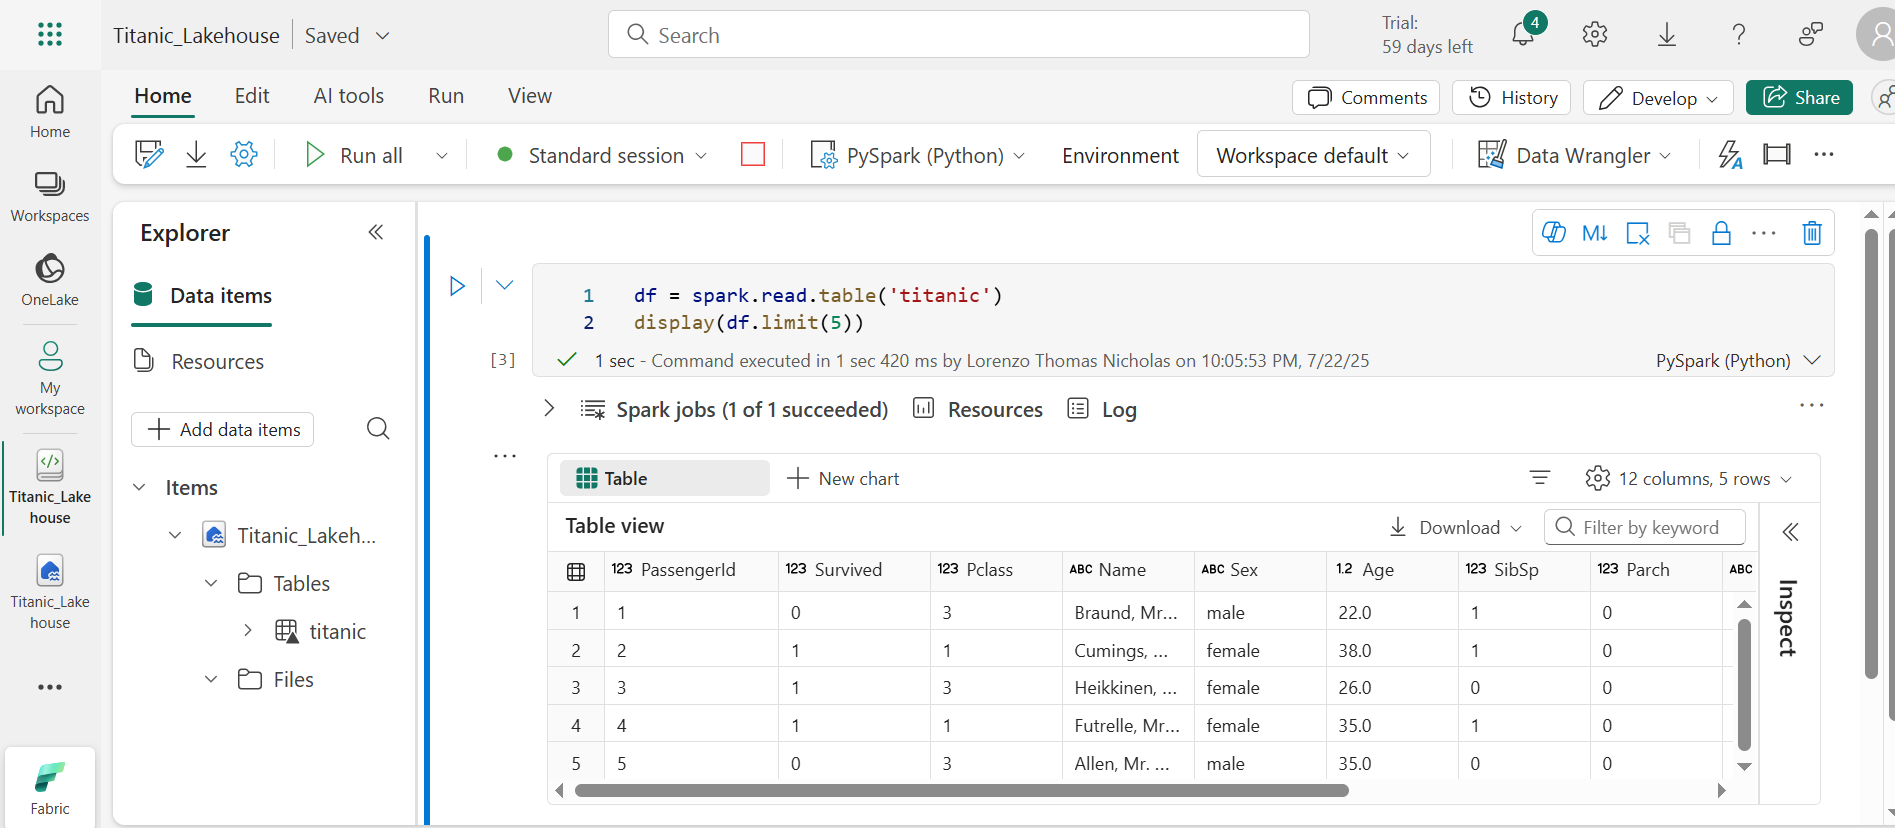
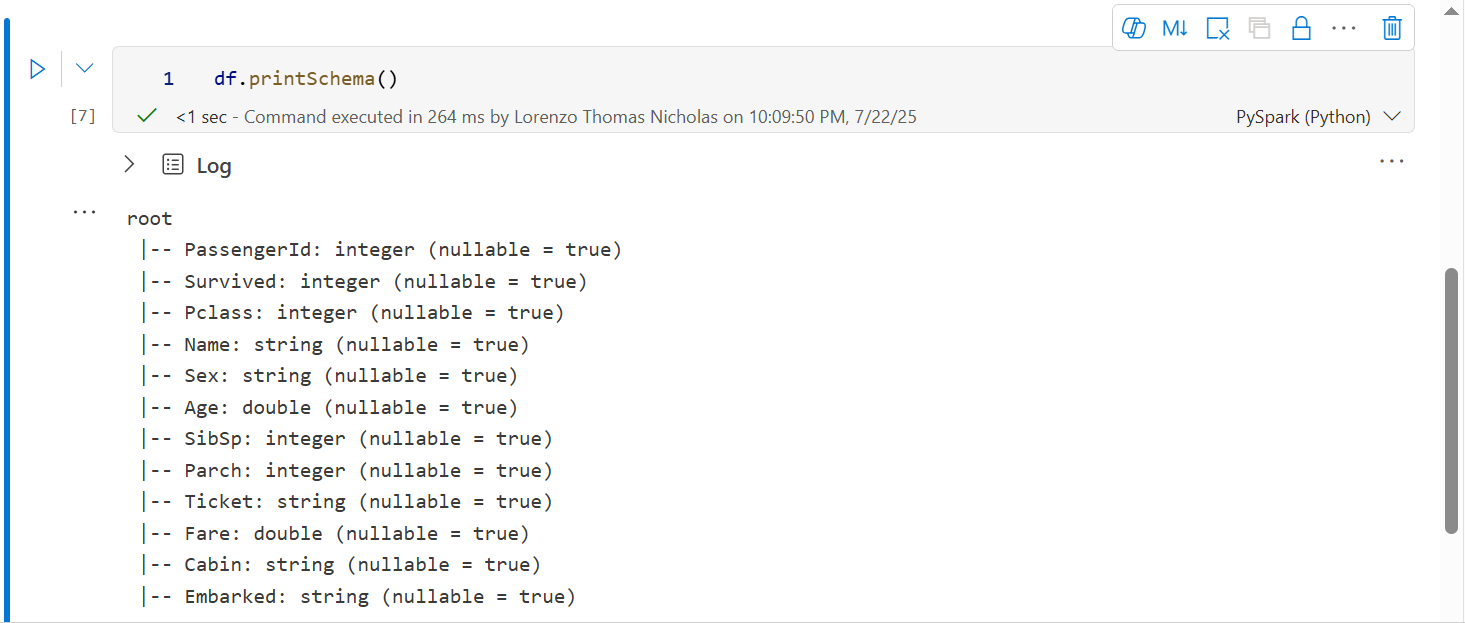
Print Schema
EndFragment